Google Maps System Design | Micro Graphs | Segments | Main Components
Micro graphs, segments, and navigation system design with a deep dive
Welcome to the 54 new subscribers who have joined us since last week.
If you aren’t subscribed yet, join 1000+ engineers and technical managers learning Advanced System Design.
Today, we’re going to design Google Maps and cover the following components:
A map as a network of nodes and segments
A map as micro graphs
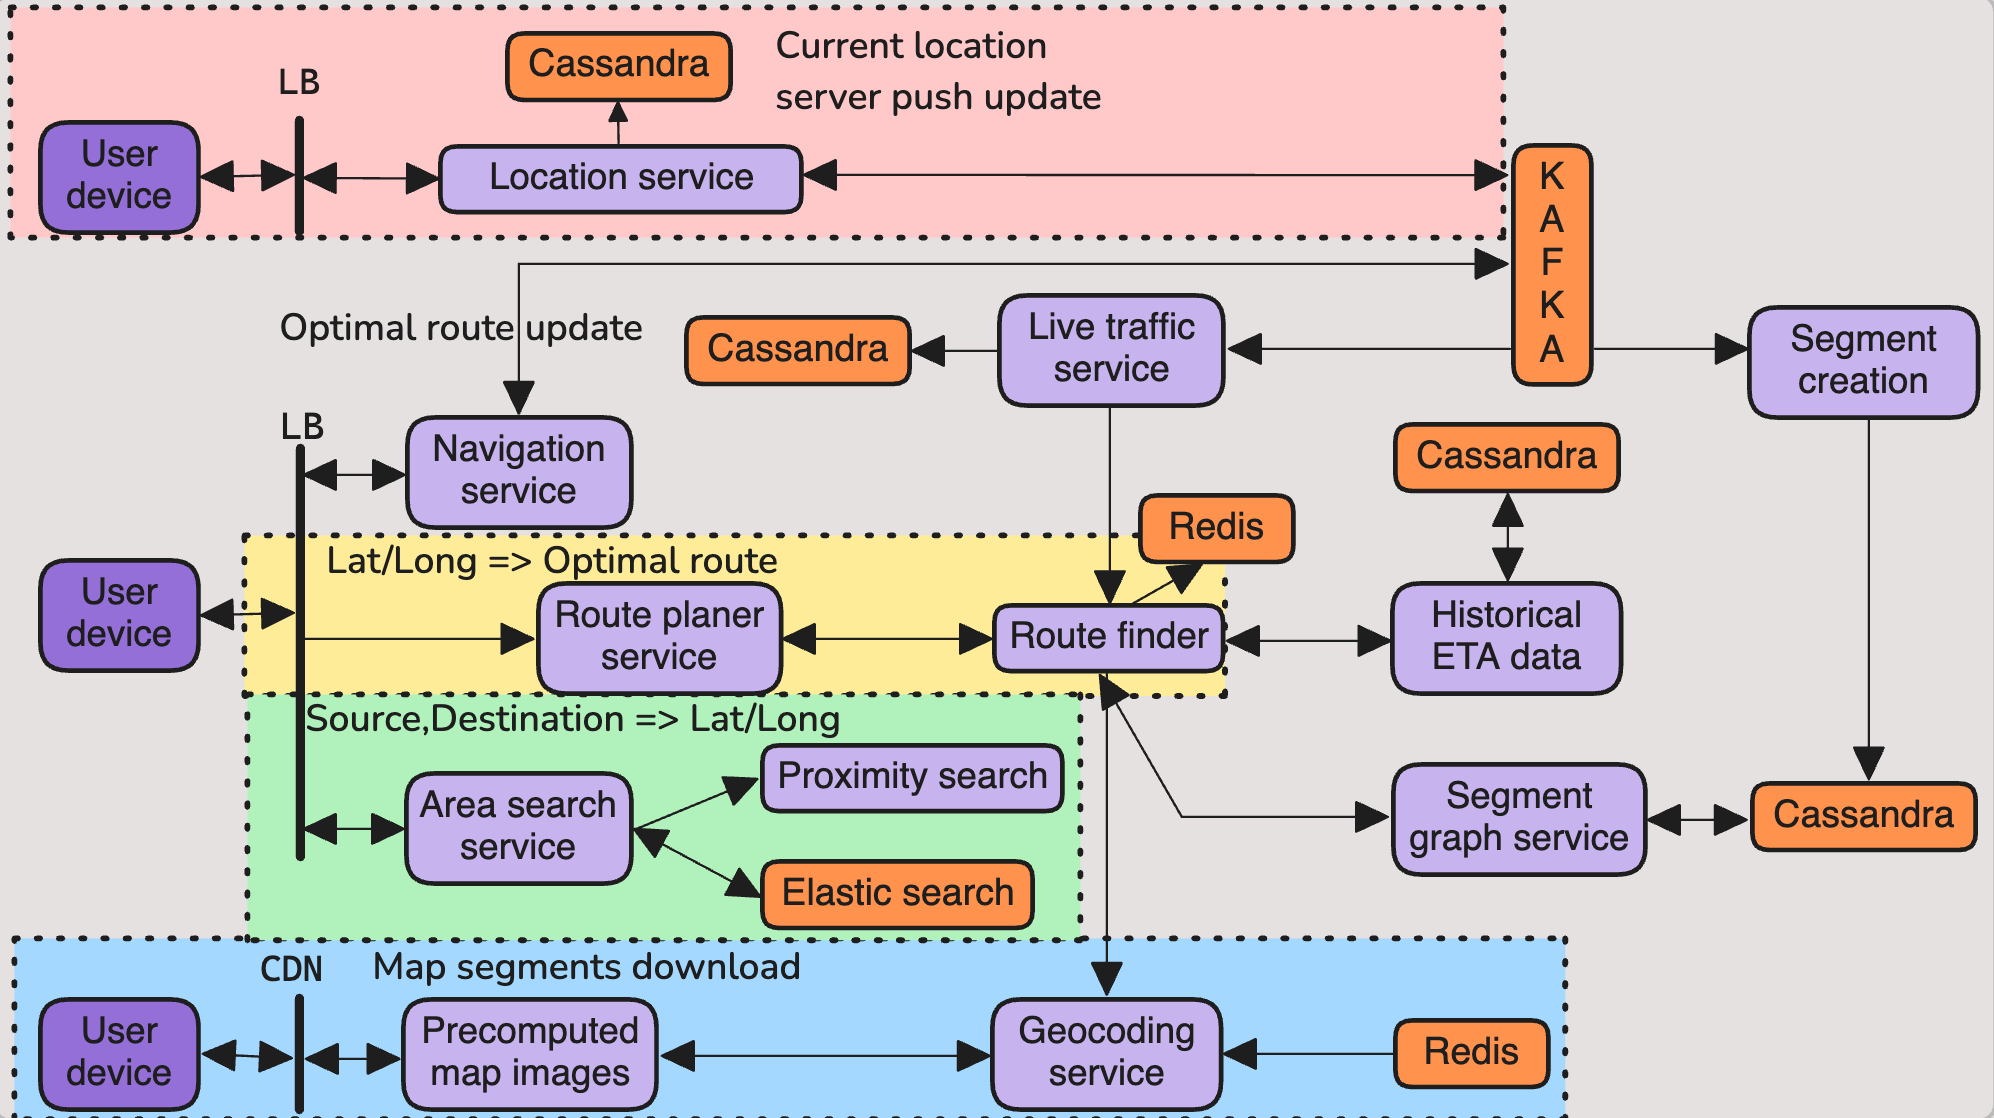
Main components and overall design
Deep dive (video version)
Google Maps is a global-scale spatial platform that integrates maps, search, routing, and real-time data. Designing something like this requires careful thinking about data modeling, system components, and performance at massive scale. Two core ideas that drive the system are segments (the smallest units of the road network) and micrographs (localized subgraphs of the network used for fast queries).
Core Data Model: Segments
At the heart of Google Maps is the road network graph.
The world is represented as a network of nodes (intersections, junctions) and segments (the roads connecting them).
Each segment carries information such as speed limits, allowed vehicle types, turn restrictions, and geometry (the shape of the road).
Segments are the atomic building blocks: all routing, traffic analysis, and ETA predictions reduce to working with these.
By versioning and caching segments, Google Maps can quickly update for construction closures, traffic changes, or new roads without needing to rebuild the whole network.
Think of segments as the “DNA” of the map—if you can get them right, everything else (routing, navigation, rendering) builds on top of them.
Localized Computation: Micrographs
The global road network is enormous (billions of segments), so you can’t compute routes on the entire graph every time. Instead, Google Maps uses micrographs.
A micrograph is a small, localized piece of the larger road graph—say, the road network covering a city block, a neighborhood, or a route corridor.
When you request directions, Google Maps extracts just the relevant micrograph around your current location and destination.
This makes routing fast (since you only work with thousands of edges instead of millions) and memory-efficient (especially on mobile devices).
Micrographs also allow for live updates: traffic incidents or temporary closures can be patched into the micrograph without waiting for a global rebuild.
In short: the global map is like the internet, but micrographs are your local cache that makes things usable in real time.
Main Components
Data Ingestion & Processing
Pulls data from multiple sources: government road databases, satellite imagery, GPS probe data from users, and live incident feeds.
A conflation pipeline merges these into a unified, consistent map of the world.
Map Storage & Distribution
Data is partitioned into tiles (geographical chunks) so the client only downloads what it needs.
Tiles are stored in a CDN for fast global access.
Rendering
Vector tiles (instead of raster images) are used so that the client can render maps dynamically, zoom smoothly, and switch styles without downloading a new map.
Routing Engine
Uses the segment graph as the foundation.
Employs fast shortest-path algorithms, optimized with preprocessing (e.g., contraction hierarchies).
Pulls in live data (traffic speeds, closures) to give real-time ETAs.
Traffic & Real-time Data
Billions of GPS probes update traffic speeds every few minutes.
Incident reports and sensor feeds allow the system to flag closures, accidents, and slowdowns.
Search & Geocoding
A geocoder index converts text queries (“coffee shop near me”) into coordinates.
Search results are snapped to the road graph so navigation makes sense.
Check out a more detailed video coverage on my Youtube.
Thank you for your continued support of my newsletter and the growth to a 1k+ members community 🙏


